Using The Data Viewer
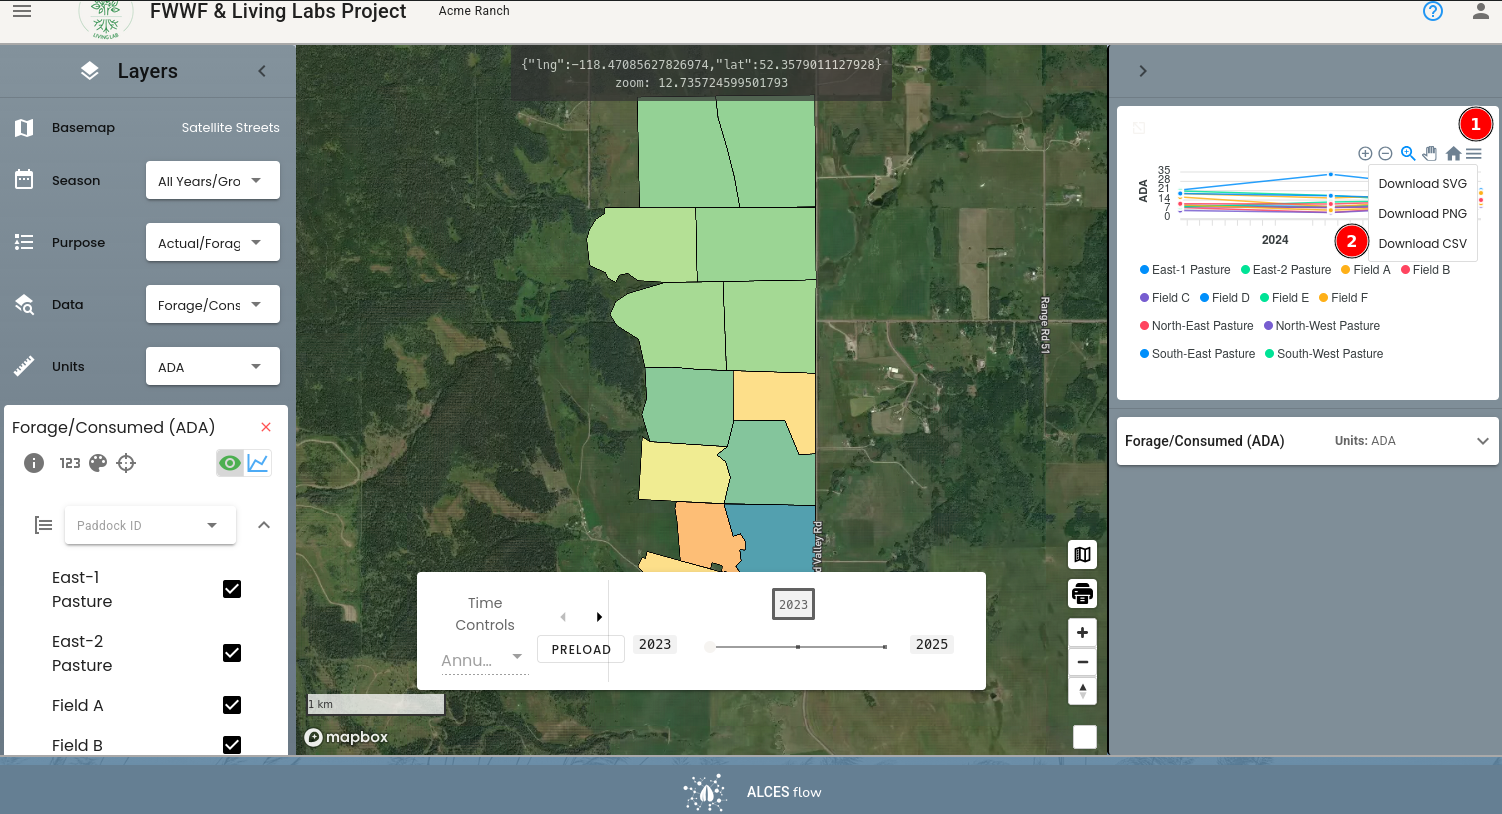
The Data Viewer is used to view summaries of the grazing data that was collected for a season. See Navigating The Website for an overview of the key elements of the Data Viewer.
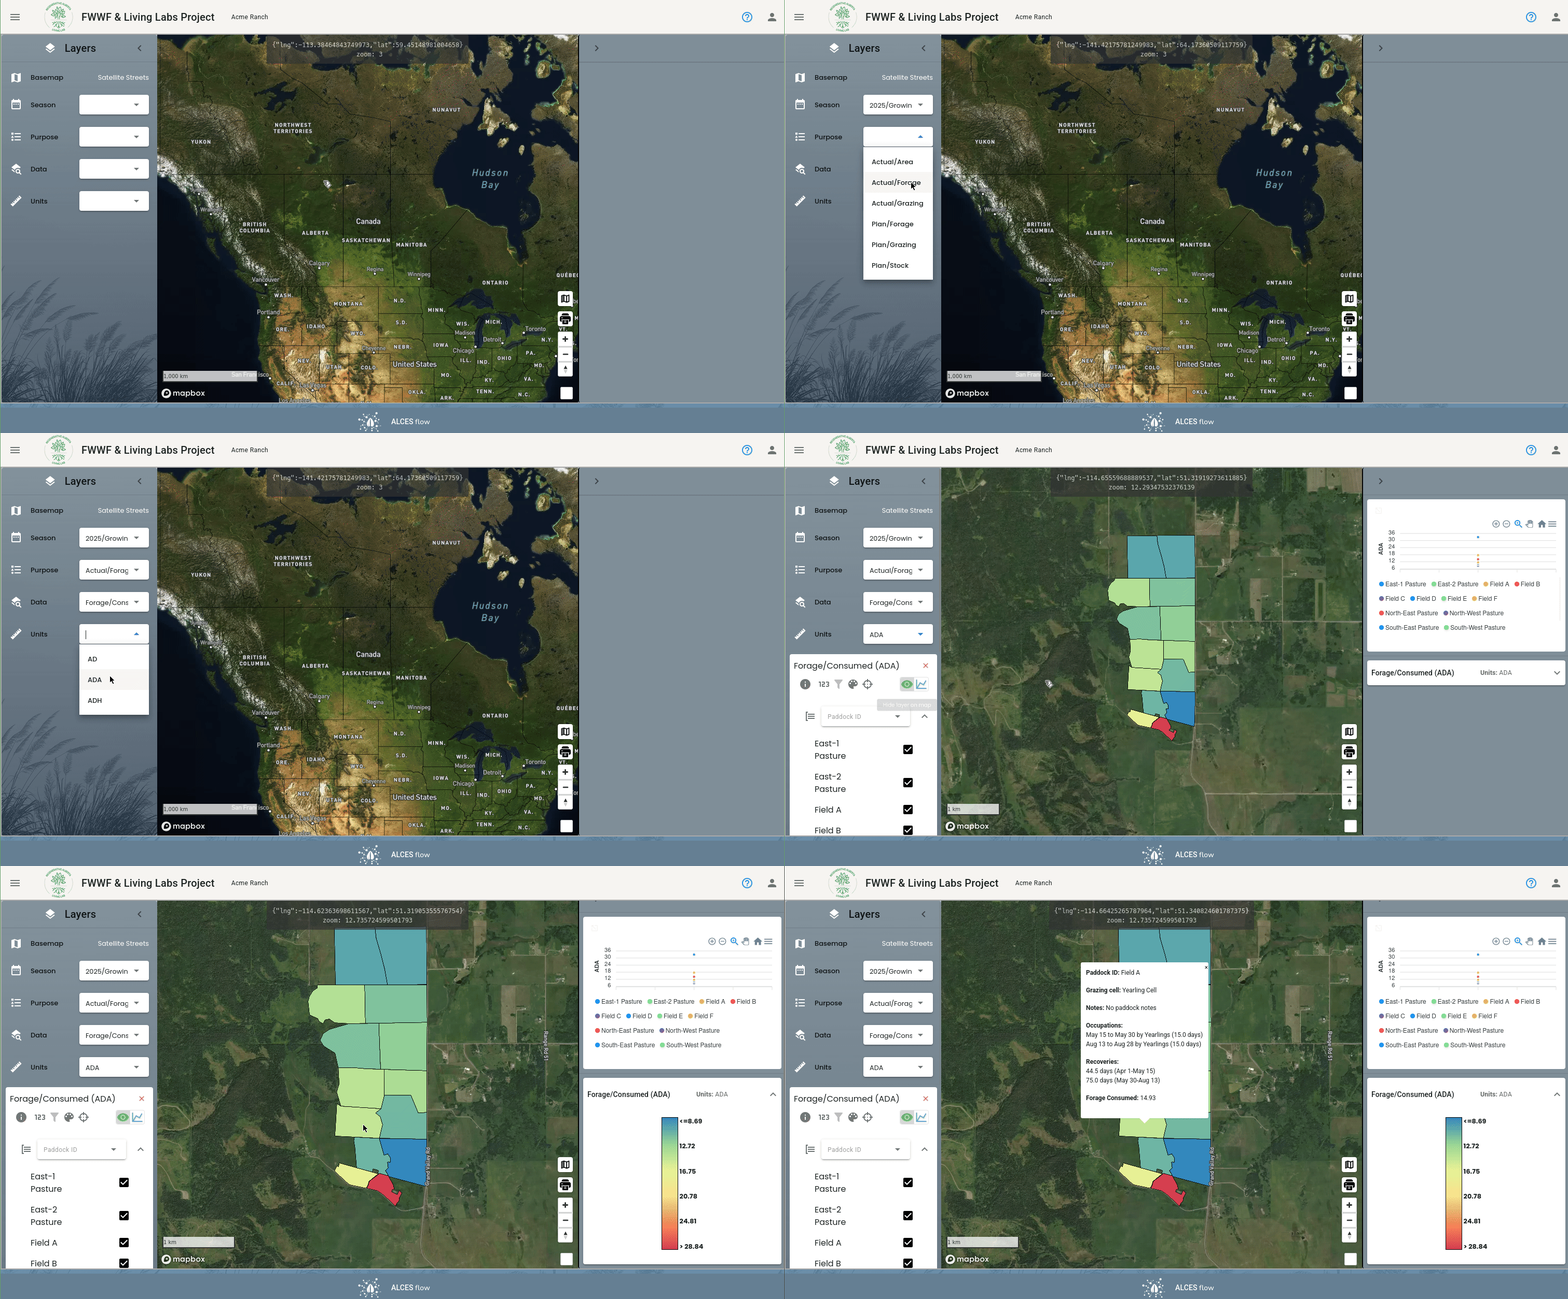
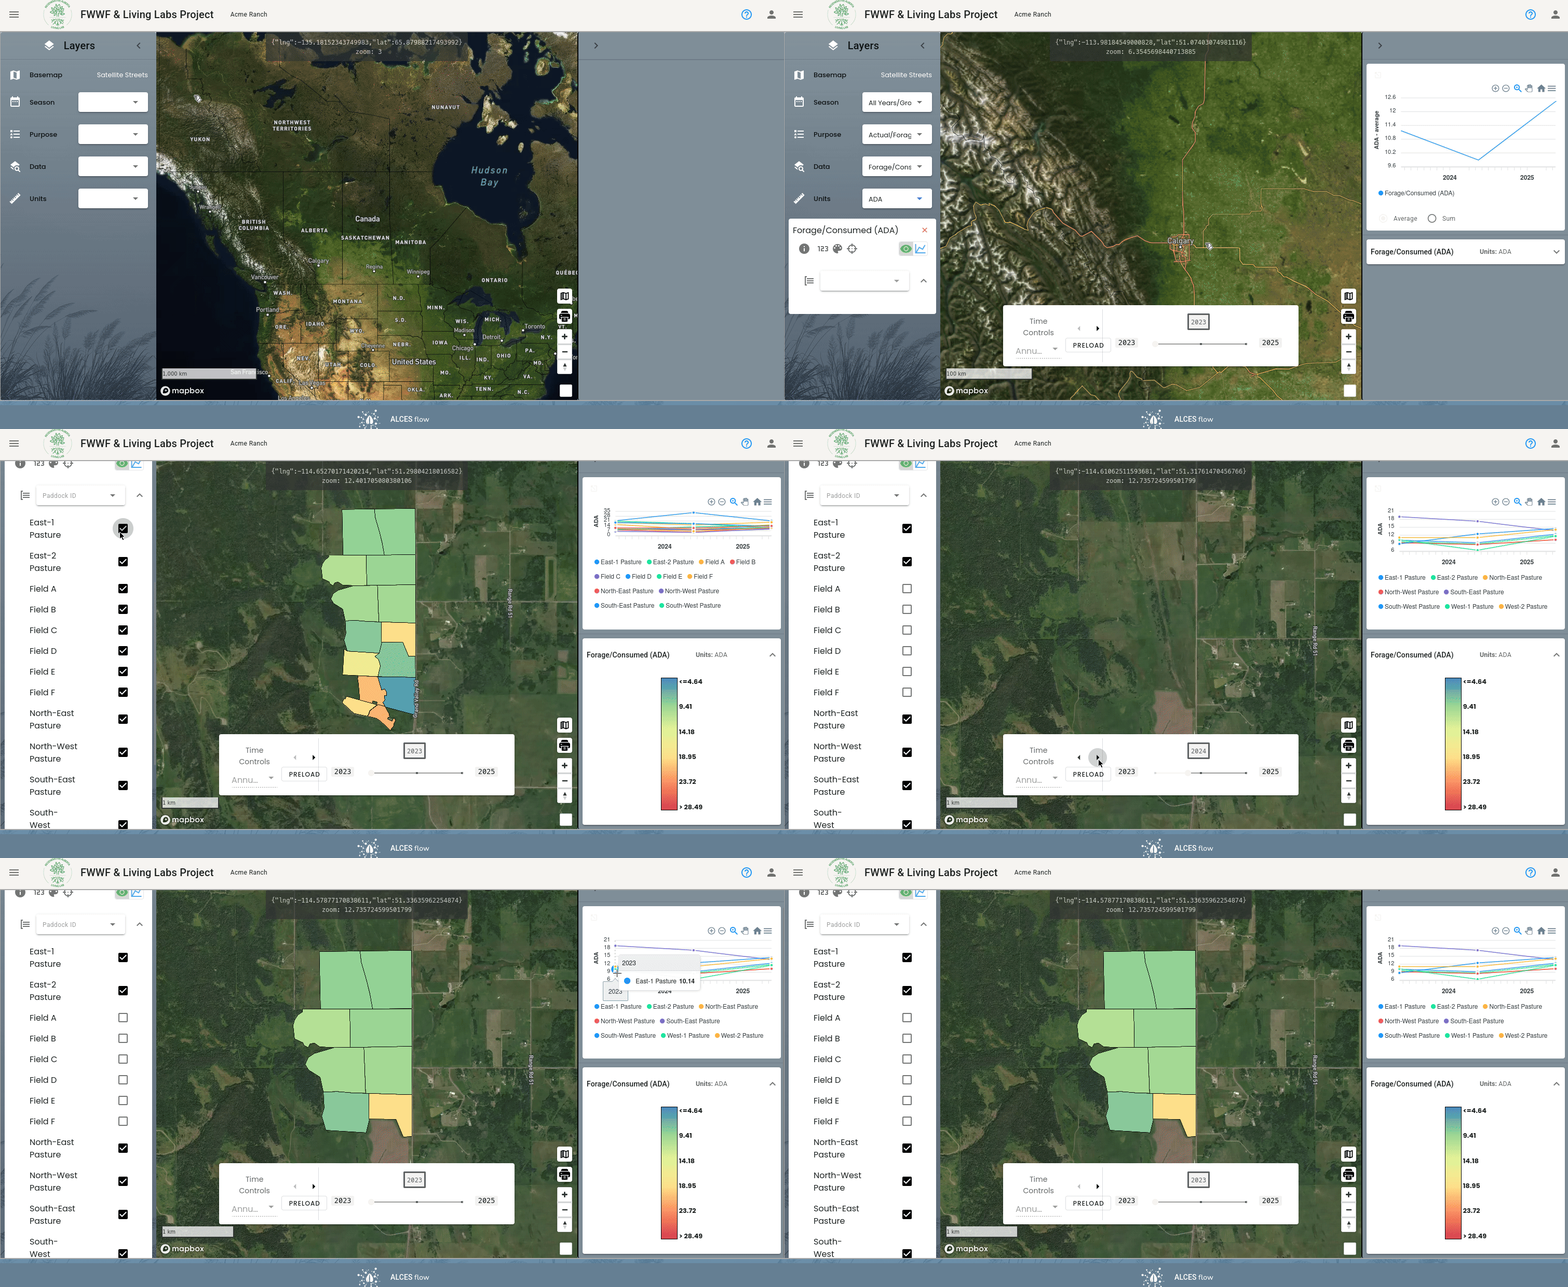
In the top left corner of the page is a number of dropdowns. These dropdowns are used to load data into the viewer.
- Season: Use this dropdown to pick the season that you want to see a summary of. Or pick "All Years" to view data across all of the years that you have collected data.
- Purpose: This dropdown filters the list of calculations that you can select in Data. Select "Actual/Grazing" if you want to see calculations related to grazing that has actually taken place. Select "Plan/Grazing" if you want to see calculations that include planned moves (i.e. actual + planned).
- Data: Use this dropdown to select the data that you want to view. See Viewing Data Descriptions to see how to view the descriptions of the calculation associated with this data.
- Units: Use this dropdown to select the units that you want to view results in.
Got an error? See the troubleshooting tips
When you try to load the data, it may fail if there is some erroneous data has been recorded. For example, a herd move was recorded on a date that isn't during the season. The error message should say what is wrong, and use the Ranch Table Manager to track down and fix the records that are causing the error. Errors are usually caused by an erroneous record that was made (e.g., a move whose date is outside the season's dates).
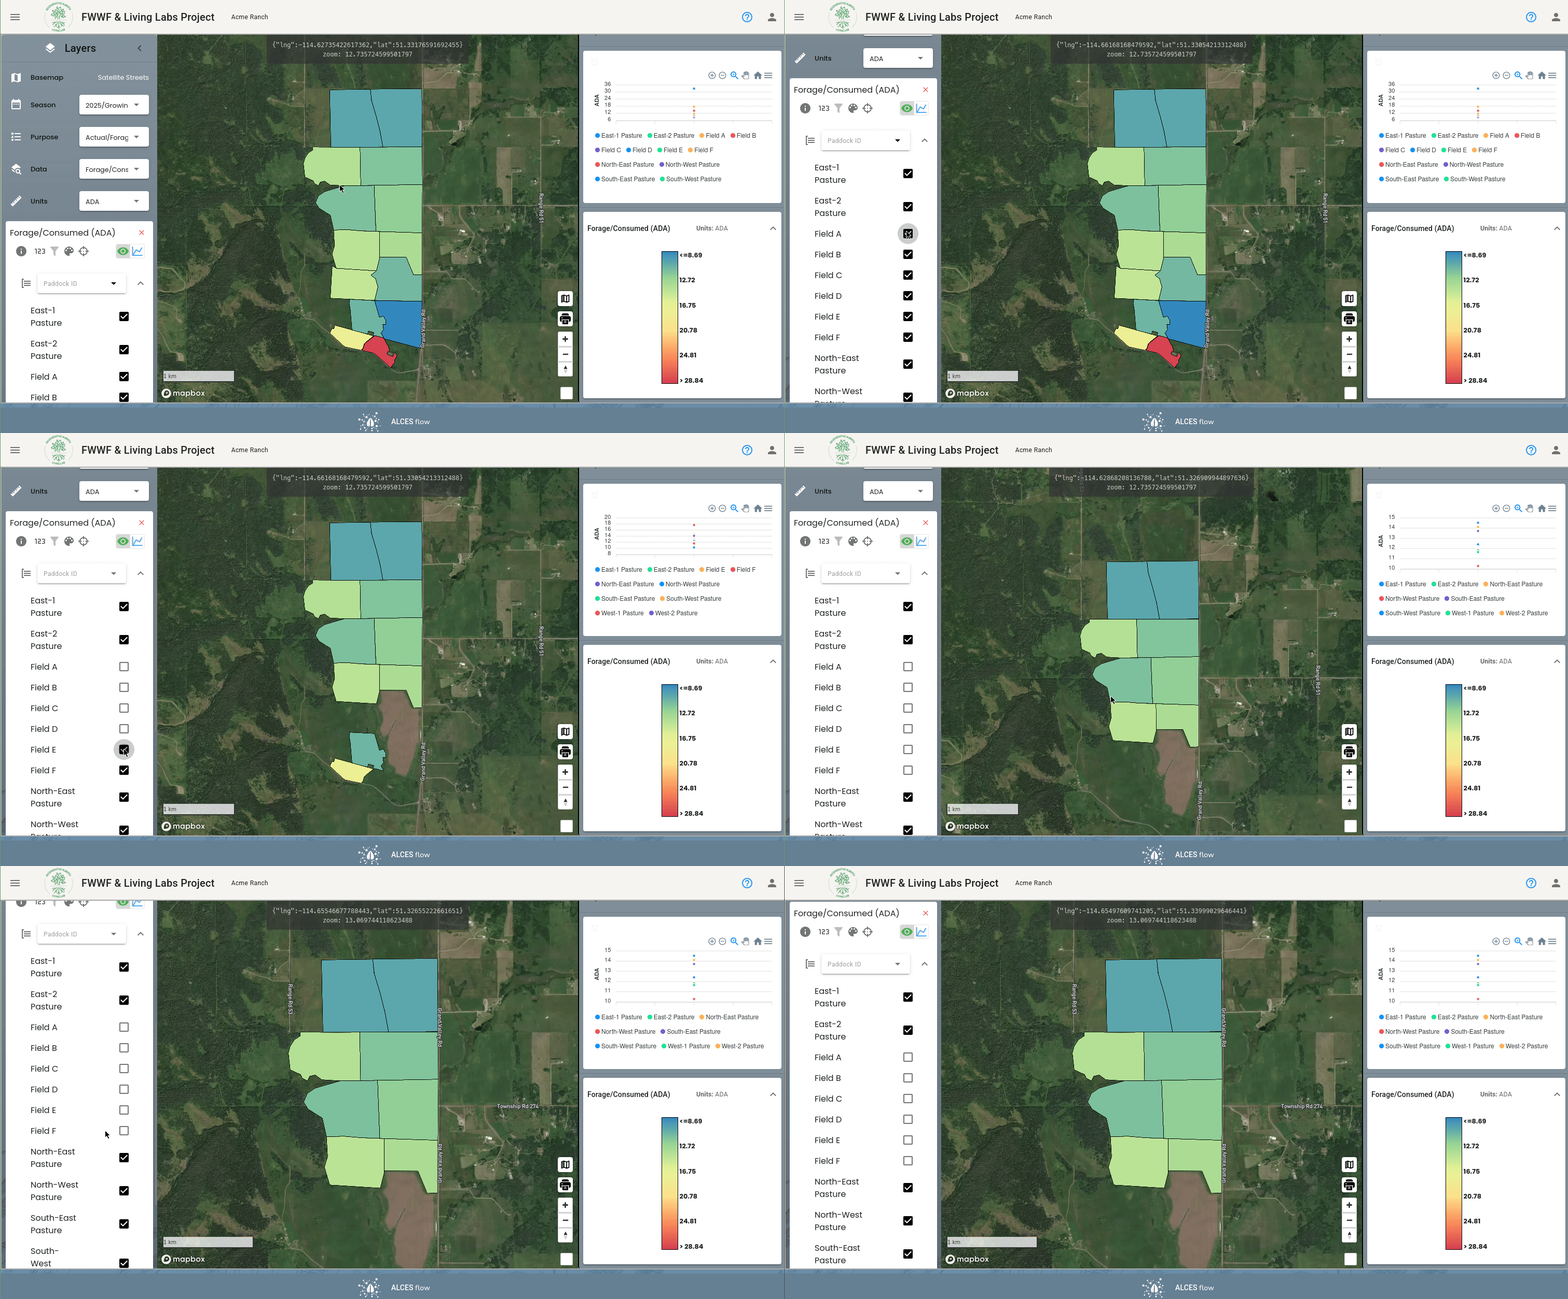
Hiding Certain Paddocks
To hide certain paddocks from the map, set the Group By () to "Paddock ID" and then uncheck any paddocks that you want to hide. This will also hide them from the chart.
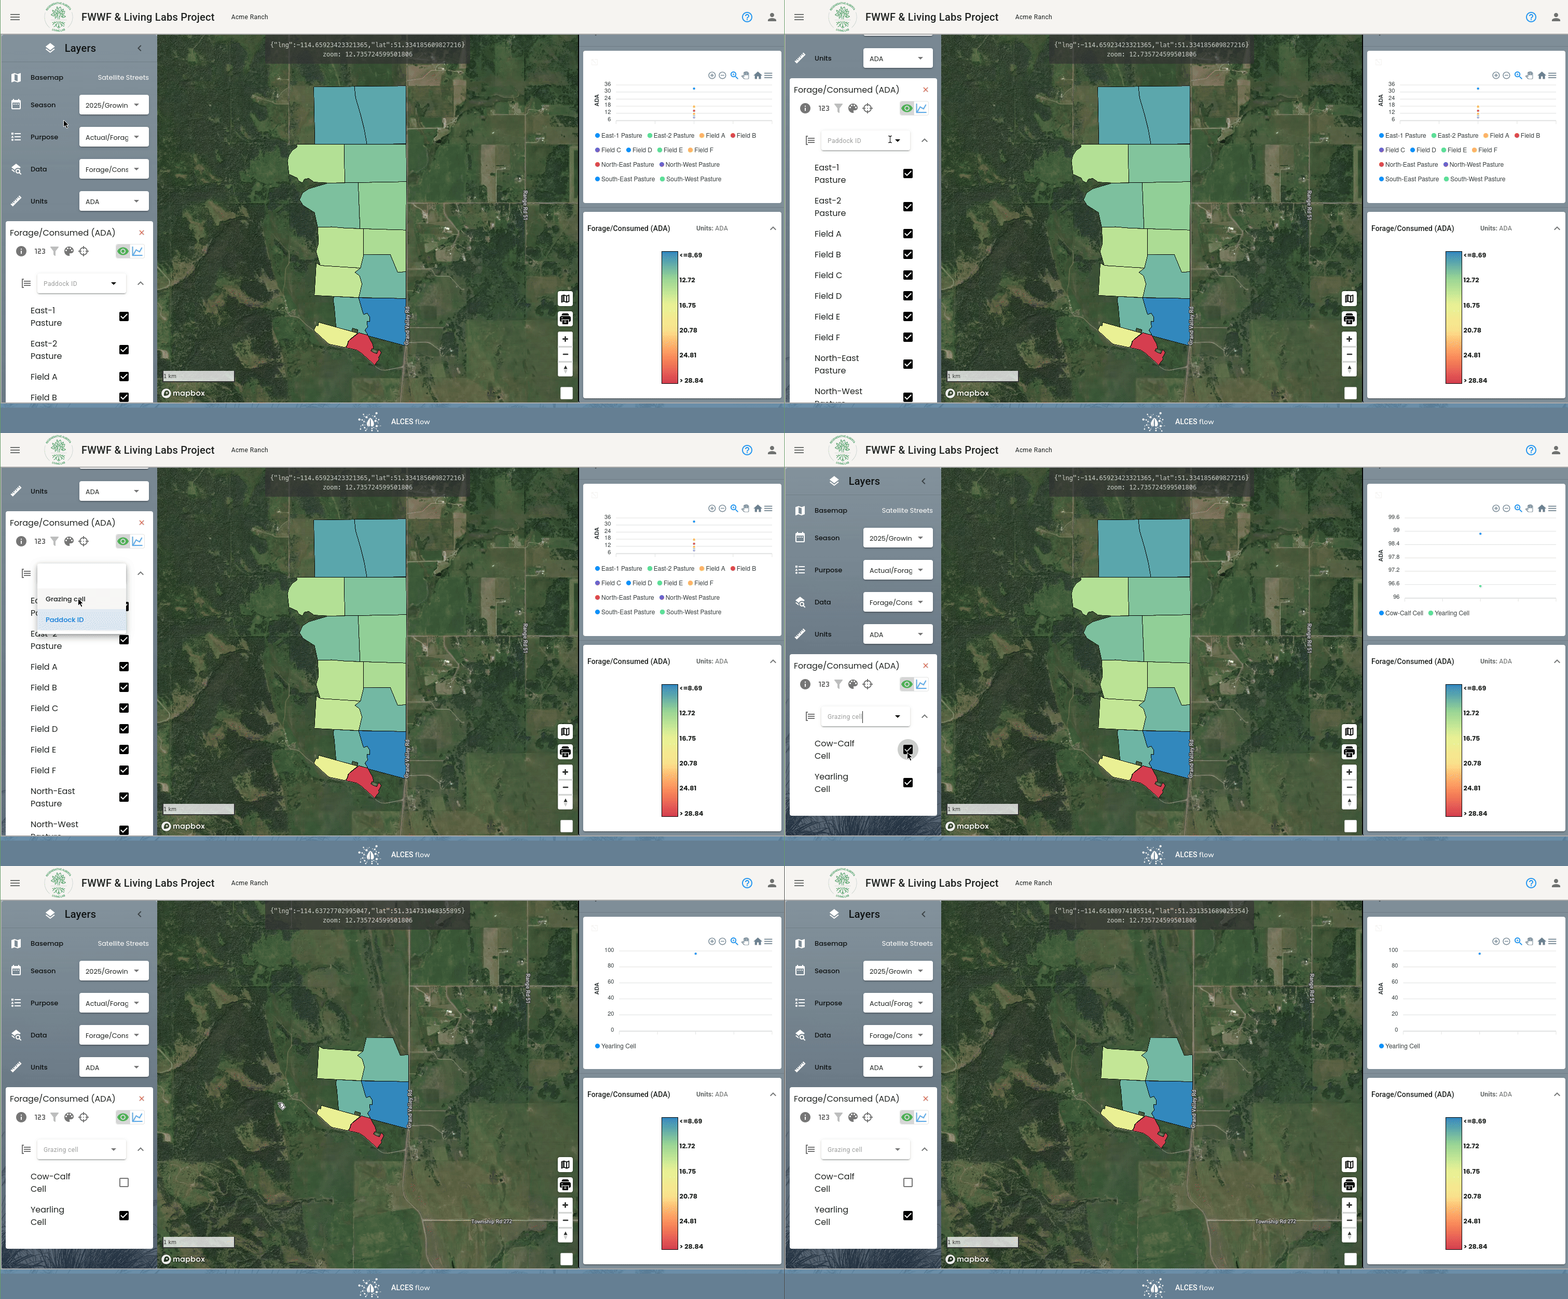
Hiding Certain Grazing Cells
To hide an entire grazing cell from the map, Group By () to "Grazing cell" and then uncheck the cells that you want to hide.
Setting the Group By to "Grazing cell" will also cause the chart (top right corner) and stats () to be the totals for the grazing cells that are shown.
Comparing Season Data Across Multiple Years
To compare data across multiple years, set the Season to "All Years/Growing" or "All Years/Dormant" to load the map with all year of data that has been recorded. This is useful for looking at how the productivity and grazing practices have changed year-to-year.
Viewing Data Descriptions
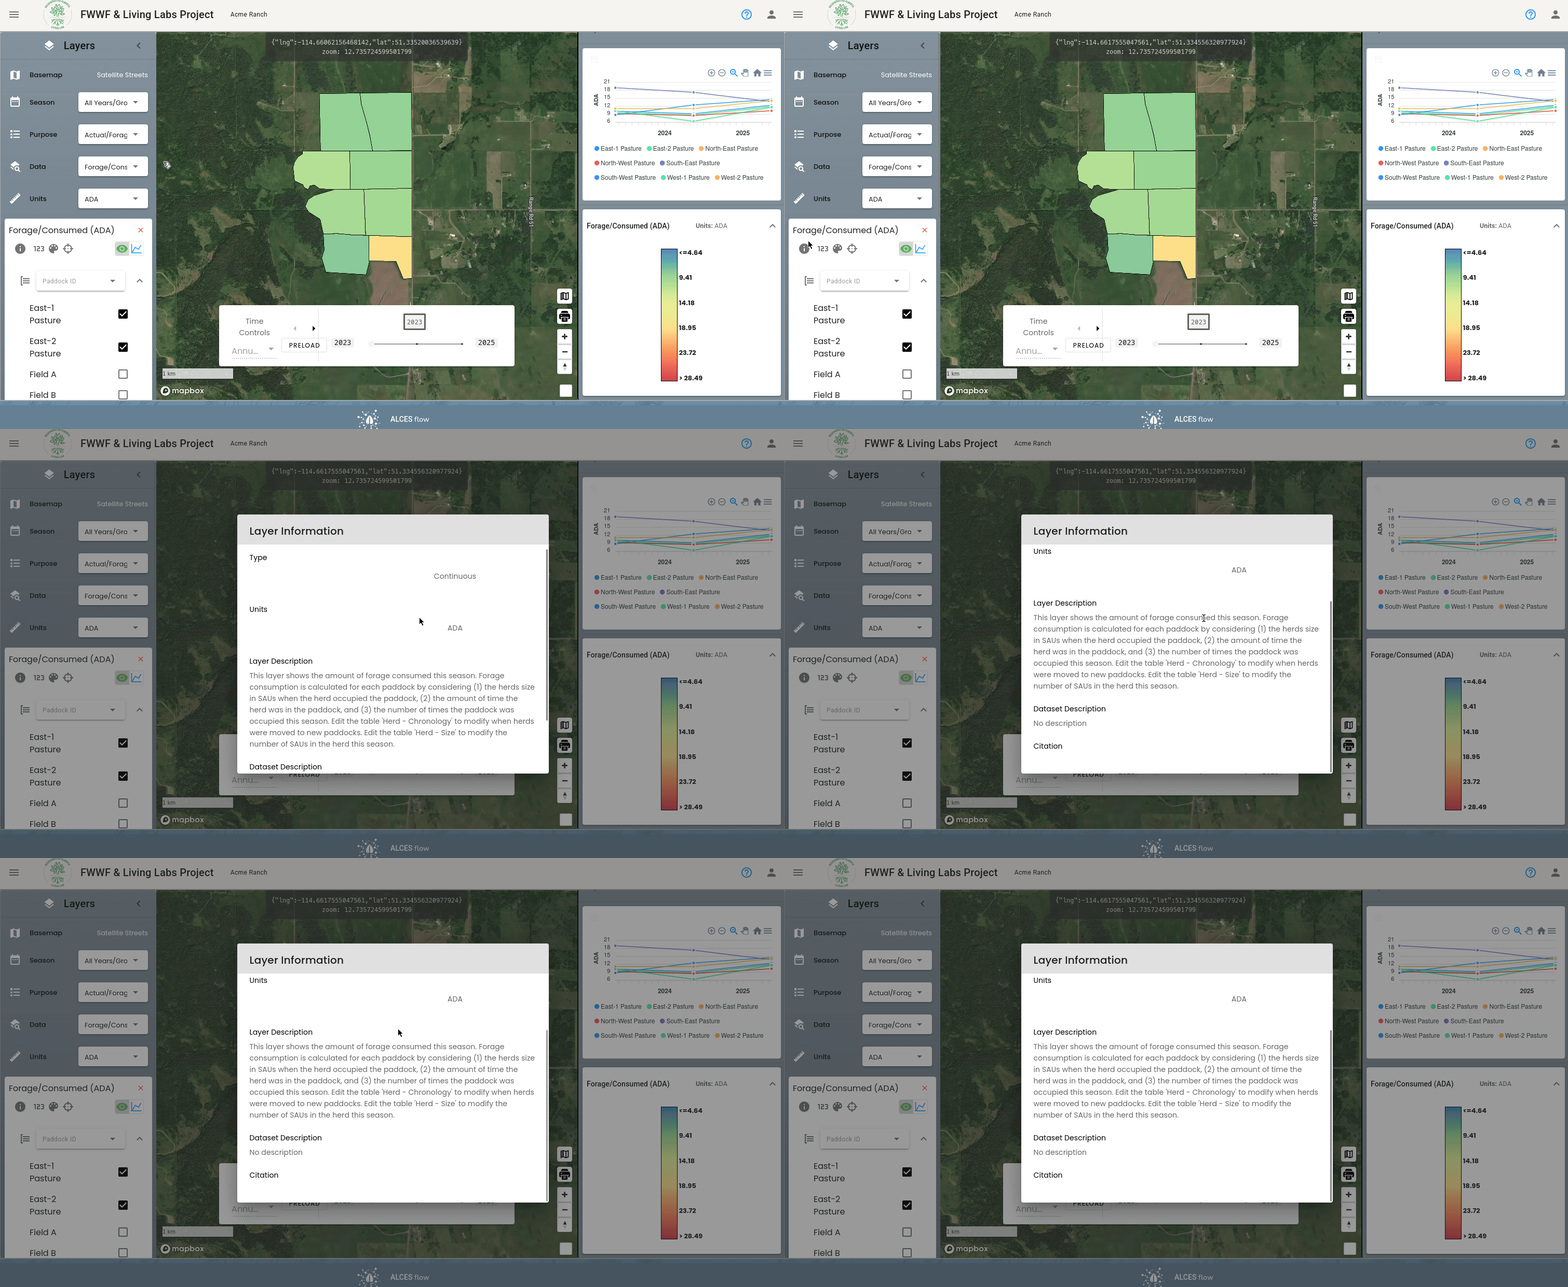
You can view a description of the calculation by clicking the button.
Exporting Summary Statistics
You can export summary statistics by clicking the button above the chart and then clicking "Downolad CSV". This will export the data that is shown in the chart, including whatever filtering/grouping you have selected, as a CSV file which is compatible with Microsoft Excel.